Results
Simulation at Eg = GeV
Moments integrated in t
Moments in the helicity frame
The x-axis of the plots is -t in GeV^2.
Download the output files:
moment0.txt ,
moment1.txt ,
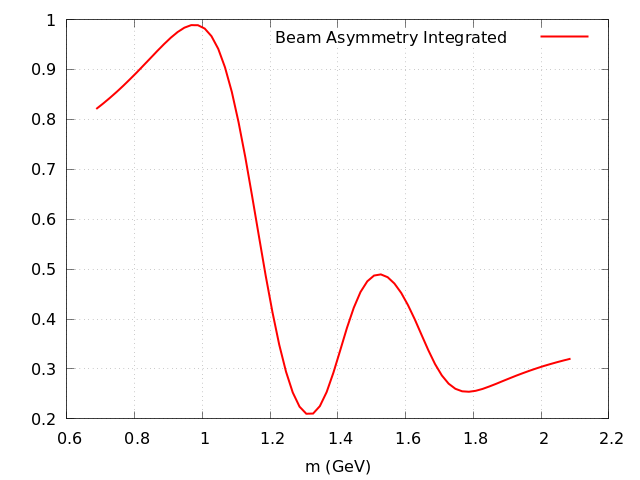
BA.txt
Download the plots:
pH00.png ,
pH10.png ,
pH11.png ,
pH20.png ,
pH21.png ,
pH22.png ,
pH30.png ,
pH31.png ,
pH32.png ,
pH33.png ,
pH41.png ,
pH41.png ,
pH42.png ,
pH43.png ,
pH44.png ,
pBA.png ,
pBAy.png